
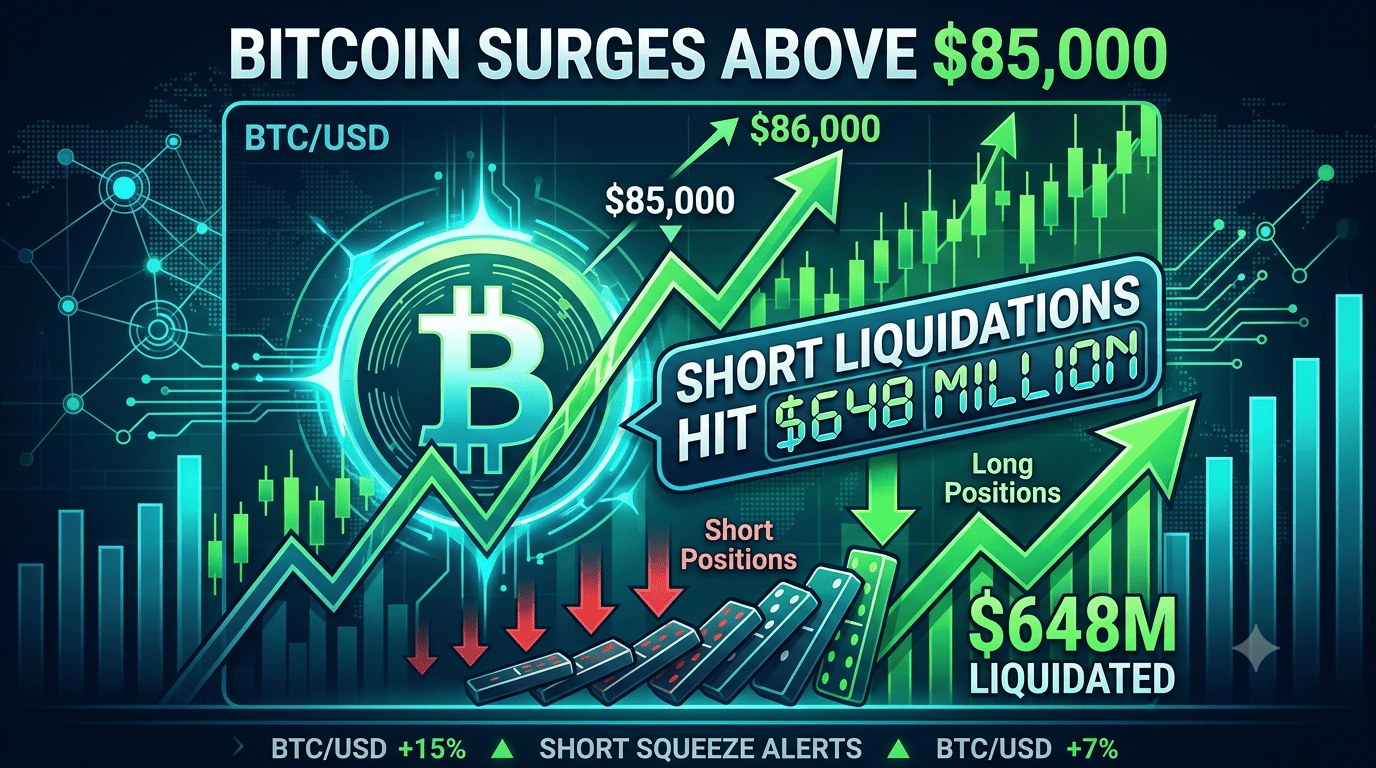
Bitcoin (BTC) experienced a significant upward movement in recent trading sessions, climbing past the $85,000 threshold for the first time in nearly a year. The digital asset reached a session peak of $85,193 before experiencing a slight retracement to approximately $84,545. This price action comes amid a period of heightened volatility in the derivatives market, where aggressive buying and forced liquidations have become the primary drivers of momentum.
The rally has been characterized by a sharp divergence between market price and underlying network activity. While the valuation of the leading cryptocurrency has advanced by 29% over the last 35 days, blockchain data indicates that the number of new and active Bitcoin addresses has not followed suit. Instead, these metrics have remained near median levels, failing to reach the highs observed over the previous two months.
Key Highlights of the Market Move
- Bitcoin reached a peak of $85,193, marking a significant recovery and a break above key psychological and technical levels.
- The surge was largely fueled by a massive wave of short liquidations, totaling $648 million within a 24-hour window.
- Technical indicators, including the 50-week and 365-day moving averages, were reclaimed for the first time in several months.
- Macroeconomic factors, such as declining oil prices and geopolitical developments, contributed to an improved global risk appetite.
The Mechanics of the Derivatives-Led Surge
The primary catalyst for the move above $85,000 appears to be rooted in the derivatives market rather than organic spot demand. According to data from CoinGlass, approximately $750.5 million in leveraged cryptocurrency positions were liquidated within a single 24-hour period. Of these liquidations, $648 million—or roughly 86%—belonged to traders holding short positions, who were forced to buy back the asset as prices climbed, creating a feedback loop of upward pressure.
The scale of the liquidations affected a vast number of market participants, with 137,386 traders seeing their positions closed. Bitcoin-specific liquidations accounted for $360 million of the total, while Ethereum (ETH) saw $171 million in liquidations. The largest single liquidation event occurred on a major exchange, valued at $11.29 million. This concentration of forced selling by bears provided the necessary liquidity for the price to pierce through established resistance levels.
Trading activity on Binance, the world’s largest cryptocurrency exchange by volume, highlighted the intensity of the move. During the opening of the European trading session, net taker volume on the platform spiked from $11 million to $618 million in just one hour. This surge in taker volume suggests that aggressive buyers were willing to cross the bid-ask spread to enter positions, further accelerating the price increase.
Technical Breakthroughs and Historical Context
From a technical perspective, the recent price action has cleared several long-standing hurdles. Bitcoin closed above its 50-week moving average for the first time since November 2025, effectively ending a 45-week period where the asset traded below this specific trendline. Historically, reclaiming the 50-week moving average has been viewed by some analysts as a signal of a potential market bottom, though historical data shows this signal has not always been a definitive indicator of future performance, particularly during the 2021-2022 cycle.
In addition to the 50-week average, Bitcoin moved above its 365-day moving average, which currently sits near the $83,000 mark. Joe Consorti, a Bitcoin analyst, noted the significance of these levels in defining the long-term trend. Alex Thorn, Head of Firmwide Research at Galaxy Digital, also pointed to the importance of these technical milestones in the context of the current 29% price advance over the last five weeks.
Despite these breakthroughs, the sustainability of the rally remains a point of discussion among market observers. The current open interest in the Bitcoin market stands at $28.83 billion, representing a 9% increase. This high level of leverage suggests that while the price is rising, the market is becoming increasingly sensitive to sudden shifts in sentiment or liquidity.
On-Chain Stagnation and Macroeconomic Catalysts
While the price and derivatives data show a market in high gear, on-chain metrics provided by Santiment and CryptoQuant suggest a more subdued reality. The number of active and new Bitcoin addresses has remained stagnant, hovering around median levels. This lack of growth in network participation creates a divergence between the asset’s price and its actual usage, a phenomenon that often precedes periods of consolidation or correction.
Ki Young Ju, CEO of CryptoQuant, has highlighted the importance of monitoring these on-chain signals to determine if the current rally is supported by new entrants into the ecosystem. Without a corresponding increase in spot demand and wallet activity, the rally remains heavily dependent on the continued stability of leveraged positions.
External factors have also played a role in the recent price appreciation. A decline in global oil prices and reports of perceived diplomatic progress between the United States and Iran have contributed to a broader improvement in risk appetite across financial markets. As geopolitical tensions appear to ease, capital has flowed back into riskier assets, providing a favorable backdrop for the cryptocurrency market’s latest move.
What Happens Next
The immediate future of the Bitcoin market likely depends on whether spot buyers step in to support the levels established by the recent short squeeze. Because the move was largely fueled by forced liquidations and derivatives activity, the market faces the risk of a sharp reversal if leveraged long positions begin to unwind. Analysts suggest that for the rally to maintain its momentum, the divergence between price and on-chain activity must eventually close.
Market participants will be closely watching the $83,000 level, which aligns with the 365-day moving average, as a potential support zone. Furthermore, the continued growth of open interest, currently at $28.83 billion, indicates that volatility is likely to persist. If the network does not see an influx of new active addresses in the coming weeks, the current price levels may be tested by those looking for more fundamental signs of growth beyond the derivatives market.